1) Salim is writing a scientific poster to report on his laboratory analysis of a compound. Consider the following three statements.
I. A 50 ml solution of 0.1 M HCI was placed in a conical flask.
II. The average concentration is within the range claimed by the manufacturer.
Ill. The table shows the titres from the titration.
Which section of the poster should include these statements?
Solution
2) Which one of the following statements is correct?
A. The presence of chiral carbons in a compound is shown more clearly by performing a volumetric analysis than by its IR spectrum.
B. The presence of chlorine in a compound is shown more clearly in its 13C NMR spectrum than in its mass spectrum.
C. The number of carbon-carbon double bonds in a compound is shown more clearly in its HPLC spectrum than by using an iodine test on the compound.
D. The presence of a primary hydroxyl group in a compound is shown more clearly in its 1H NMR spectrum than by adding acidified potassium permanganate to the compound.
Solution

3. Lucia, a VCE student, investigated the production of bioethanol from the fermentation of glucose solution in the presence of yeast. Enzymes in yeast assist with the fermentation reaction. Lucia trialled two methods for the investigation, Method A and Method B. Both methods were trialled once.
Write a balanced chemical equation for the production of bioethanol from glucose. 1 mark
Solution
ii. Why is boiling water not used in Step 1 of Method A and Method B?
Do not refer to safety considerations in your answer.
Solution
b. Lucia recorded the followi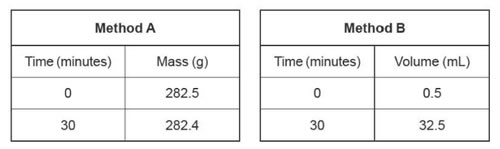 ng results for Method A and Method B.
i. Calculate the amount, in mol, of gas produced using Method A. The molar mass of the gas produced is 44.0 g moI - 1. 1 mark
Solution
ii. Calculate the amount, in mol, of gas produced using Method B at standard
laboratory conditions (SLC). 1 mark
Solution
iii. State an assumption on which the calculation in part b.ii is based. 1 mark
Solution
iv. Compare the resolution of the data in Method A and Method B. 2 marks
Solution
c. Lucia decided to use Method B with different amounts of glucose to test how changing the concentration of the glucose solution affects the rate of bioethanol production. Lucia recorded the volume of gas produced at three-minute intervals instead of only after 30 minutes. The graph below shows the data produced.
i. What is the independent variable in this investigation? 1 mark
Solution
ii. Does the graph support Lucia's hypothesis? Explain your answer. 2 marks
Solution
d. i. Identify one limitation of Method 8. Your answer must be different to your answer for part b.iii. 1 mark
Solution
ii. Which section of the scientific poster for the investigation should include the
limitation identified in part d.i?
Solution