Magnetic braking is used in variety of ways. When braking is critical to the safety of all those on board, no matter what the weather and even in an electrical failure, magnetic brakes are used. Roller coasters and other theme park rides employ magnetic braking to ensure safety.
A magician uses magnetic breaking in an act involving a guillotine. He demosntrates the impact of the blade on different objects such as a carrot which it slices with ease. He then secretly brings close a set of magnets places his hand in the guillotine and releases the blade.
The blade is connected to magnets that will slide down through an aluminium pole of a certain thickness. The magician now needs to fine tune his act and cause the blade to slow sufficiently before it strikes his hand. He needs to find the right width of aluminium tube that will slow the falling magnet to exactly 10 cm/s over a length of 30.0 cm. This is critical as a speed faster than 10 cm/s will hurt the magiian and any speed slower than 10 cm/s will reveal the trick to the audience.
What is the relationship between the thickness of the aluminium pipe and the rate at which the magnet falls through it?
Purchase aluminium foil of different lengths, as shown on the right.
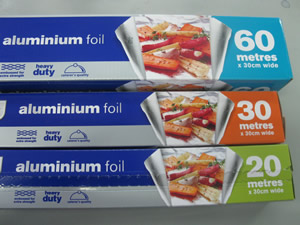
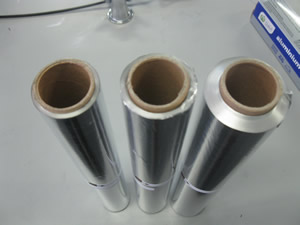
Measure the thickness of the aluminium foil wrapped around the cardboard tube.
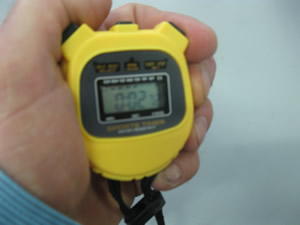
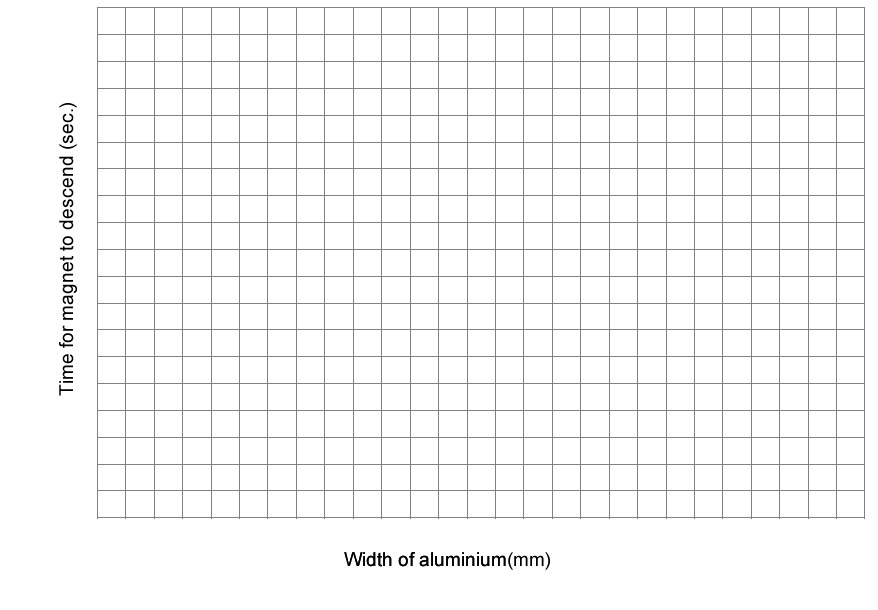
| Thickness (mm) | Time (seconds) |
5) Apart from the diameter of the cardboard tube, what other variables must be kept constant? Explain why these variables must be kept constant.
6) Are there any safety considerations.
7) What other investigations can the magician perform before deciding on the width of aluminium pipe? In other words, is there any other investigation that you can think of that would add value to the findinngs of this investigation?
Sourced from(25/082018 1.22pm) http://ismackinsey.weebly.com/uploads/1/3/7/2/13724948/writing_a_myp_laboratory_report.pdf
Writing a Laboratory Report for Science
Title - The title should be general, explaining what the experiment is about.
Aim - The aim should state what you are trying to find out.
Hypothesis - State what you expect to find out in your experiment and why using scientific reasoning. That is, what you expect to find out in the aim and why.
Variables and Fair Testing - The variables are the things you measure in the investigation. List them under the following headings:
- Control Variables: These are the ones that must be the same in each experiment.
- Independent Variable: This is the one variable that you deliberately change in the experiment. There should only be one! Dependent Variable: This is the one variable you measure to find your results.
Materials/Apparatus - List all the apparatus and materials used. Include a relevant diagram at this point.
Method - Write instructions explaining how to do the experiment. They must be detailed enough for somebody else to follow so they can do the experiment. Point form is suitable. Explain how to control the variables.
Results - Using tables, record what happened, including measurements and observations (also anything you heard, saw, smelled if applicable). Tables must be clearly presented and easy to read with titles and units. The data from the tables should be analysed and presented as a suitable graph(s) if possible. Graphs should include a title, labelled axes and units. The independent variable should be on the horizontal axis. Include any calculations. The graph(s) should be analyzed and explained using scientific reasoning. Examples of analysis include: finding and interpreting the meaning of the gradient (slope) and/or intercepts, interpreting the shape of the graph(s), finding the equation(s) of the line of best fit (trendline), comparing graphs to one another or to the control, etc.
Conclusion - This section explains what you found out from your investigation. You should: Read the question of the aim again and try answering it by looking at the results. Write down why you know your hypothesis was correct/incorrect. Explain any unexpected results. Comment on the reliability/validity of the data given the strength of correlation supported by your data, and sources of error. Write down some ways you could improve your experiment. This should be changes to the method, not comments like “I should have done my calculations more neatly.” Think of any further things you would like to investigate.