Extrapolation and interpretation of data
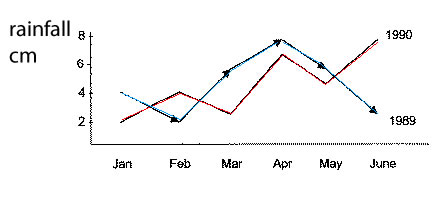
Consider the graph on the right. It shows the rainfall during several months of the year.
a) How much rain fell in April of 1989?
b) What is the difference between the rainfall in Feb of 1990 and Feb of 1989?
c)
Which year had the greatest total rainfall for the period of time shown?
d)
Which is the wettest month on the graph?
e) Identify the independent and dependent variable.
We simply extend the graph to where the volume is zero. In other words we continue the graph to the x-axis and read the temperature at the point where the graph intersects the x-axis, as shown below.
Several solutions of glucose were tested to see how much light of a particular wavelength they each absorbed. The results are presented in the table below.
|
Glucose
concentration (g/ml)
|
Absorbance(absorbance
units)
|
|
0.000
|
0.000
|
|
0.005
|
0.100
|
|
0.010
|
0.190
|
|
0.015
|
0.285
|
|
0.020
|
0.375
|
On the set of axis provided below, plot a graph of absorbance versus concentration.
Another solution of glucose had an absorbance reading of 0.550. What is the glucose concentration of this solution?
Solution