Rates and catalysis
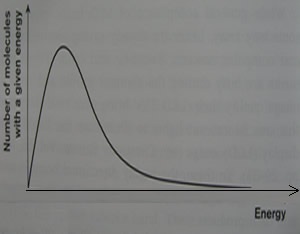
The two diagrams on the right represent the distribution of molecular energies for 1 mole of gas at 300 K.
a) Draw a curve to show the distribution of energies for 1 mole of gas at a higher temperature.
Student answer
Click the above link to see a possible student answer.Is the student's answer sufficient for 2 marks?
If not what are the errors that you can point to.
Solution
b) Draw a curve to show the distribution of energies for 2 mole of gas at 300 K
Student answer
Click the above link to see a possible student answer.
Is the student's answer sufficient for 2 marks?
If not what are the errors that you can point to.
Solution