Acid base (2009 NSW HSC)
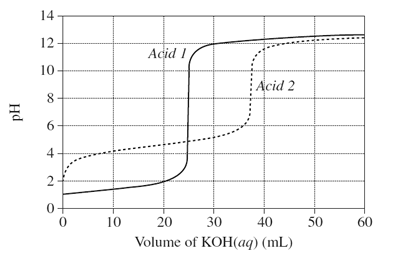
1) The graph shows changes in pH for the titrations of equal volumes of solutions of two monoprotic acids, Acid 1 and Acid 2.

(a) Explain the differences between Acid 1 and Acid 2 in terms of their relative strengths and concentrations.
Solution
(b) Name the salt produced by the reaction of an acid of the same type as Acid 2 with KOH(aq).
Solution
(c) Calculate the concentration of hydrogen ions when 20 mL of KOH(aq) has been added to Acid 1.
Solution
(d) Why would phenolphthalein be a suitable indicator for both titrations?
Solution
