In this activity students will prepare a calibration curve relating the mass of a metal precipitate to the concentration of the metal in the solution used. Standard solutions will be used to derive the calibration curve. A standard solution is one whose concentration of a given substance, in this case lead, is known accurately. The calibration curve will then be used to calculate the concentration of the metal in an unknown sample of water.
Apparatus :
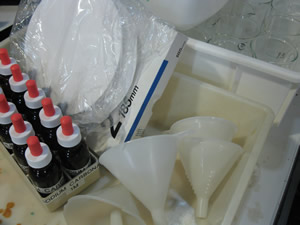
- filter paper and funnel
- 0.5 M Na2CO3 Sodium carbonate
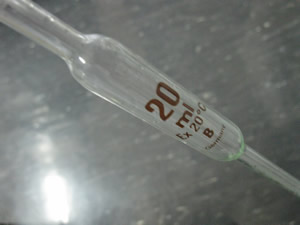
- 20 mL pipette
- 8 X 200 mL beakers
- Standard solutions of
Pb(NO3)2 0.1M, 0.2M, 0.4M, 0.6M
- 50 mL measuring cylinder
- electronic balance
- a prepared solution of lead nitrate between 0.2M and 0.6 M
with solid impurities (sand, plant matter) added.
Safety - Lead nitrate is toxic. Wear a lab coat, gloves and goggles.
Step 1 Collect samples of each of the 4 solutions of lead nitrate.
Step 2 Take 20.0 mL samples of each solution using a 20 mL pipette and place each sample in clearly marked beakers.
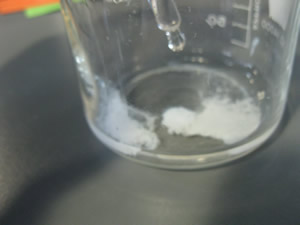
Step 3 To each solution add 30 mL of sodium carbonate measured with a measuring cylinder. A white precipitates will form.
Step 4 Using a pencil label four filter papers with the concentration of the lead nitrate used eg 0.1, 0.2, 0.4, 0.6 and weigh them recording their mass.
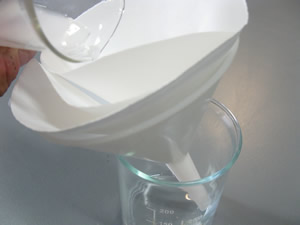
Step 5 Filter each solution to recover the precipitate. Make sure all the precipitate in the beaker is washed into the filter paper using distilled water. Wash the precipitate left in the filter paper with distilled water.
Step 6 Collect the filter papers with precipitates and allow them to dry overnight before weighing them. Calculate the mass of each precipitate.
Step 7 Construct a calibration curve of mass of precipitate vs concentration
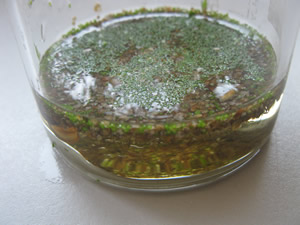
Step 8 Obtain an unknown sample of contaminated water and filter to remove solid particles.
Step 9 Using a 20 mL pipette transfer 20.0 mL of the filtrate into a beaker and add 30 mL of 0.5 M sodium carbonate. A white precipitate will form.
Step 10 Weigh and record the mass of a filter paper. Filter the precipitate as before making sure to wash thoroughly
Step 11 Dry and weigh the filter paper and calculate the mass of the precipitate.
Step 12 From your calibration curve determine the concentration of lead in the water.
1) Why is it important to wash the precipitate thoroughly?
2) To find the concentration of lead in an unknown solution, a set of standard samples of known concentration were analysed and the results graphed. What is the general name of the graph?
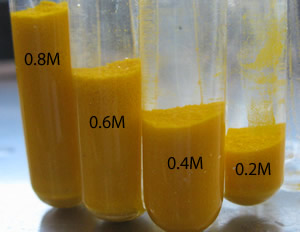
3) Four solutions of known concentration of lead were used to form lead iodide, a yellow precipitate. The general term for these solutions is
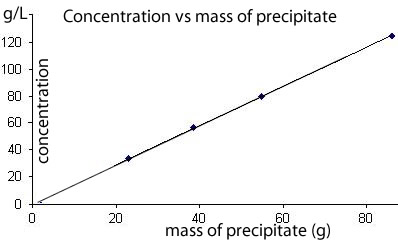
4) Four solutions of known concentration of substance X were analysed by precipitating out X from 20 mL sample and weighing the dry precipitate. The results were graphed as shown on the right.
a) 20 mL of a solution with a concentration of 60 g/L will form a precipitate of mass
b) A 20 mL solution of unknown concentration formed 60 grams of precipitate. Its concentration of X is
c) A 60 mL solution of unknown concentration formed 60 grams of precipitate. Its concentration of X is