Adapted from http://www.science.org.au/nova/001/001print.html accessed 20/6/2012
With fixed organisms such as trees or barnacles, one can count the individuals in a small area. However, if you need to estimate the number of trees in a vast forest it is only necessary to count several sample areas. From the numbers in the sample areas you can estimate the total number and the population density of the trees
To calculate the population of a species, such as trees or barnacles, over a vast area follow the steps below.
- Define the whole area (A) in which the population is to be estimated.
- Choose a small sampling unit (area a). This is an area in which you expect to be able to see and count all individuals. For example, your sampling unit might be a rectangle with an area of 1 square metre. Ecologists call these sampling units quadrats.
- Choose a sample size (n). This is the number of quadrats that you will select in area A. The selection of quadrats must either be random (if you can select a lot of quadrats) or representative (if you are restricted to only a few).
- Count the number of individuals in each quadrat.
- Find the average number of individuals per quadrat. To do this, divide the total number of individuals by the number of quadrats.
- Calculate the estimated number of individuals (N) in the whole area, as follows:
Total population = Average number per quadrat × Total area/Area of quadrat.
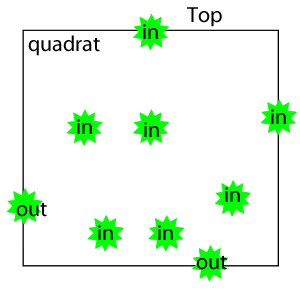
Note the edge effect: What to do with organisms which touch the edge. Are they counted "in" or "out"?
The rule is if they touch the right side or the top, count them "in". If they touch the bottom or the left side, count them "out". When you are working as a group you must decide between you, which is the top of the quadrat, before you start counting.

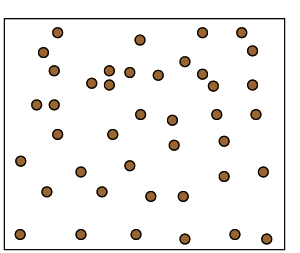
Consider the image on the right of a square paddock 25 m2. A number of stick insects (circles) are shown feeding on grass. Following the steps outlined above answer the following questions.
Click to see the sampling.
1) What is the size of the quadrats?
2) What is the sample size?
3) Are the quadrats random or representative?
4) What is the average number of insects per quadrat? (total number of insects / number of quadrats)
5)
What is the total number of insects in the total area?
6) What would make the estimation of the total population of insects more accurate?

Your estimated number of individuals (N) is not the actual number of animals in the area, but a reasonable approximation. How close it is to the real number will depend on how large a and n are. The more quadrats you select, and the larger each is, the better the estimate will be, but more (and larger) quadrats require more time and effort.
Calculating the population density is simple once you know the total number of individuals in a population and the total area. Divide the total number of individuals by the total area and express the result as number of individuals per unit area.
Counting shy organisms that move around or are nocturnal
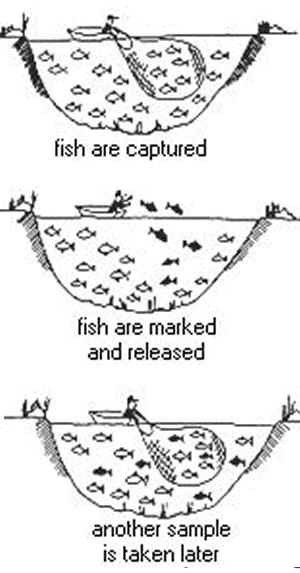
For many organisms that move around, such as small mammals and fish, carrying out a census is not easy. Animals can be surveyed (eg, red kangaroos are large enough to be counted from the air) but the technique must be used very carefully and systematically by counting in several locations and at different times. Another method is called 'mark, release and recapture'. The animals to be counted are captured, marked in some way so that they can be recognised later, and then released. With a little calculation, you can estimate the total population size from the proportion of marked and unmarked animals in the second trapping session, as the following procedure shows.
- Define the area in which the population is to be estimated.
- Decide how to catch and mark the species in question.
- Catch a reasonably large number of animals within the study area, all during a relatively short time (usually minutes to hours).
- Mark all the animals caught and release them. (The method of marking must not harm the animals nor make them conspicuous to predators.) The number caught, marked and released is M animals.
- Leave the area for a while to allow the marked animals to mix completely with the rest of the population.
- Repeat the capture procedure. Sort the animals caught into marked and unmarked. The number of marked animals is m and the total number of animals (marked + unmarked) is n.
- The estimated total number of animals (the population size N) in the area is calculated as follows:
Total number = Number marked × Total number caught/Number of marked ones caught.
Consider the image on the right.
1) What is the number of fish marked?
2) What is the the number of fish caught for the second time?
3) How many are marked?
4) What is the best estimate for the population of fish?

the number of animals you manage to catch and mark as a percentage of the total,
whether the marked animals mix properly with the unmarked ones,
whether any lose their marks or are affected by being marked.
migration, births and deaths that take place between the two sampling events can also result in inaccurate estimates.
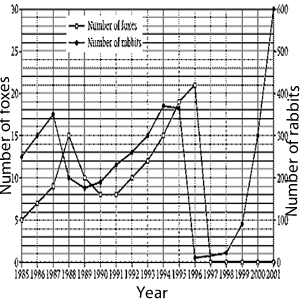
The graph on the right shows the populations of rabbits and foxes in one particular habitat. Discuss how measuring populations and density can be beneficial under the following heading:
-pest control;
-predicting population trends of interrelated species;
-food webs.
What is the reason the fox population died out in 1997?
What is the reason for the explosion in the rabbit population after 1998?
What evidence can be obtained from the graph that rabbits are prey for foxes?
What evidence do you have that rabbits are the only food source for the foxes?
What evidence do you have that the fox is the only predator feeding on the rabbit population?
